

 Facebook
 X
X
 Pinterest
 Copy Link
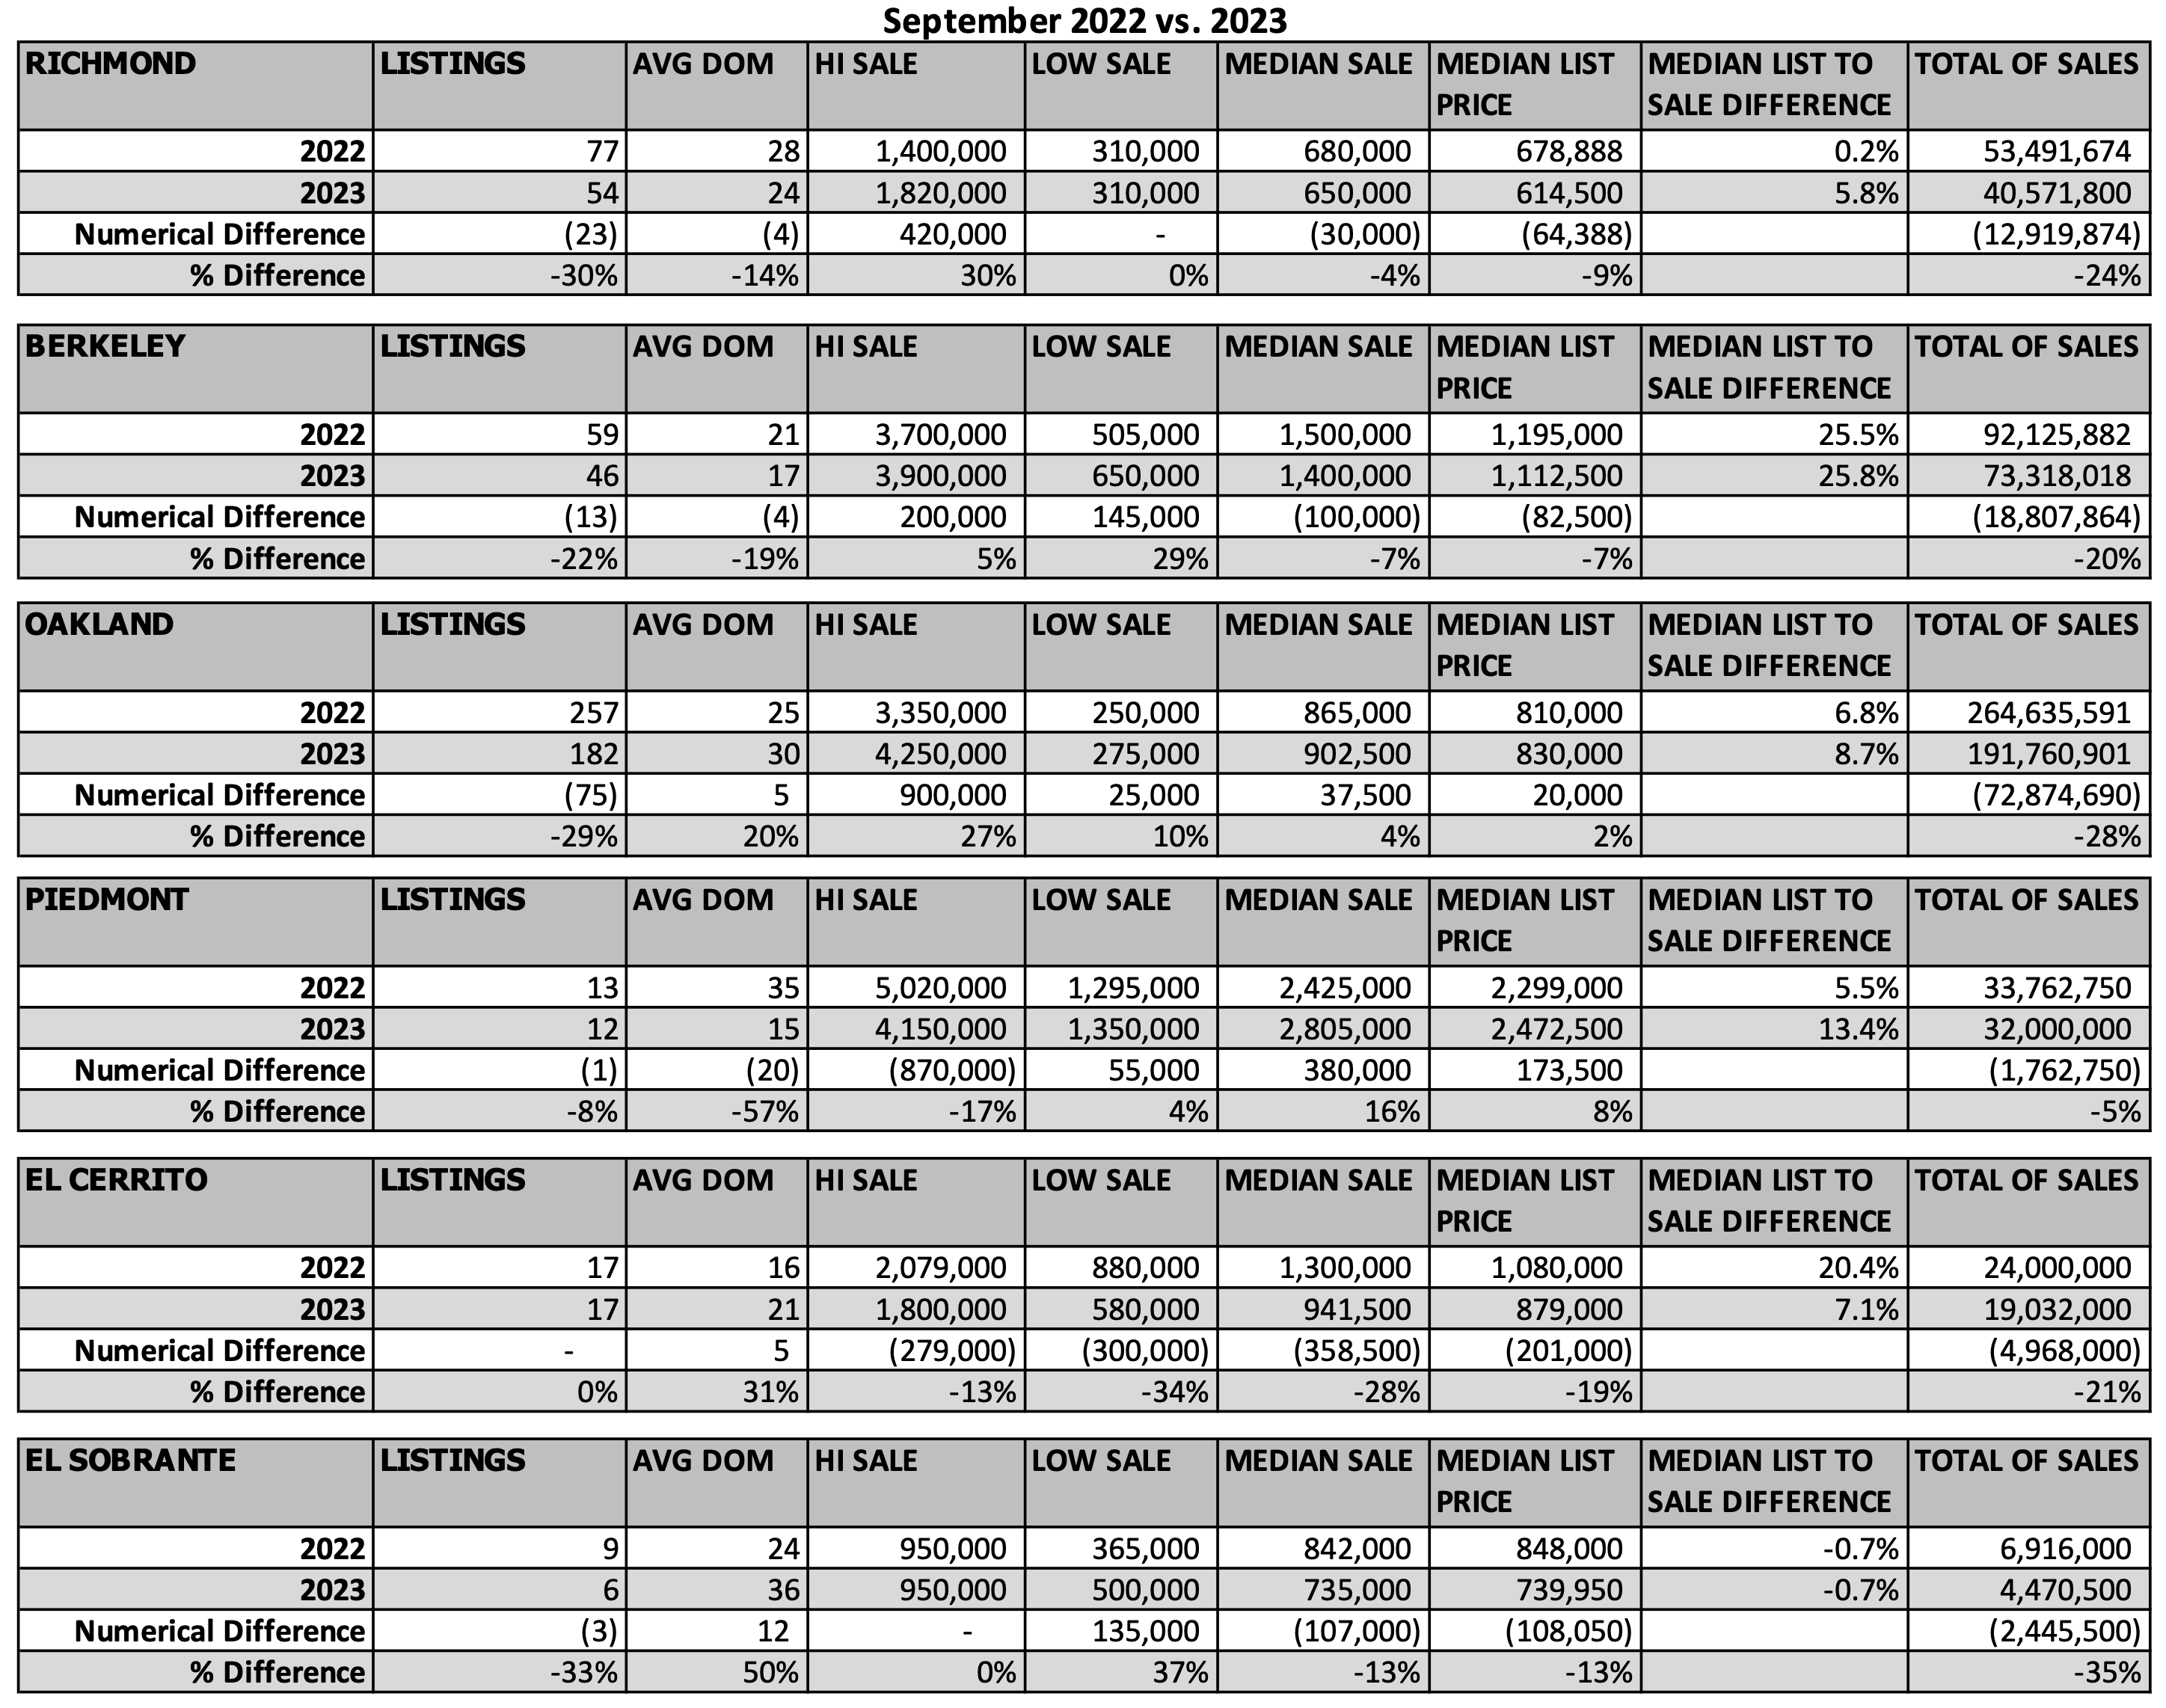
Today we’ll delve into home sales data from six East Bay cities: Richmond, Berkeley, Oakland, Piedmont, El Cerrito, and El Sobrante. We’ll compare sales in September 2022 with those from the same month this year. The numbers will show us how the market is doing and what we can expect to see going forward.
Richmond:
• The number of listings in Richmond decreased significantly, from 77 to 54, reflecting a 30% drop in homes for sale in the month.
• Surprisingly, the average number of days to sell a home (DOM or Days on Market) decreased from 28 to 24 days, a 14% improvement.
• The most striking change is the highest sale price, which jumped 30% from $1.4 million in 2022 to $1.82 million in 2023.
• The median sale price, however, slid 4% from $680,000 to $650,000.
• Total sales showed a substantial 24% decline, with a decrease of approximately $12.92 million in sales volume.
Berkeley:
• Berkeley exhibited a similar pattern with a 22% decrease in listings (13 fewer homes) compared to the previous year.
• The average DOM was also better in Berkeley, dropping from an average of 21 days to the current 17 days, a 19% improvement.
• The highest sale price grew 5%, up from $3.7 to $3.9 million.
• The lowest sale price saw a significant 29% increase, rising to $650,000 from $505,000.
• The median sale price dipped 7% from $1.5 million to $1.4 million.
• The city’s total sales declined by 20%, with almost $19 million less in sales revenue this September.
Oakland:
• Oakland’s listings dropped from 257 last September to just 182 this year, a decrease of 29%, or 75 homes fewer for sale.
• The average DOM increased from 25 to 30 days, an increase wait for sellers of 20%.
• The highest sale price surged by an impressive 27%, up from $3.35 to $4.25 million.
• The lowest sale price also increased, up 10% from $250,000 to $275,000.
• The median sale price in Oakland rose 4%, from $865,000 to $902,500.
• Total sales in Oakland dropped by 28%, representing a hefty $72.87 million drop in volume from last September.
Table 1: Sales Data Year Over Year – September 2022 vs. 2023
Piedmont:
• Piedmont listings went from 13 to 12 homes on the market, a decrease of 8%.
• Average DOM improved significantly from 35 days last September to just 15 days this year, a 57% upturn.
• The highest sale price, however, decreased by 17%, from $5.02 million to $4.15 million.
• The lowest sale price saw a slight increase of 4%, from $1.295 to $1.35 million.
• The median sale price increased by $380,00 from $2.425 million to $2.805 million, a gain of 16%.
• Total sales in Piedmont was down just 5%, with only $1.76 million less volume this year.
El Cerrito:
• El Cerrito listings in September of both years was constant at 17.
• Average DOM went up from 16 to 21 days, taking 31% longer to sell a home this year.
• The highest sale price decreased from $2.079 million to $1.8 million, a 13% drop.
• The lowest sale price also fell significantly from $880,000 to $580,000, a 34% decrease.
• The median sale price decreased by 28%, from $1.3 million to $941,500.
• Total sales in El Cerrito dropped by almost $5 million, a 21% decrease in volume from $24 million last year to just over $19 million this September.
El Sobrante:
• El Sobrante listings fell from 9 to 6, a 33% downturn.
• The average DOM jumped from 24 to 36 days, a 50% increase in the time from listing to sale.
• The highest sale price remained unchanged at $950,000.
• The lowest sale price increased by 37%, from $365,000 to $500,000.
• The median sales price went down 13%, from $842,000 to $735,000.
• Total sales in El Sobrante decreased by 35%, representing a difference of $2.45 million in volume.
Conclusion:
As we scrutinize real estate data year over year from September 2022 and September 2023 across these East Bay Area cities, we find noteworthy market trends.
One of the most striking trends is the surge in sales prices of the most expensive properties in Richmond and Oakland. I think this reflects a growing demand for luxury real estate in areas outside the traditional high-end markets of Piedmont and Berkeley. The highest value home sale in Piedmont decreased by 17% year over year. In Berkeley the high sale rose, but only 5%.
On the flip side, the median sales price in El Cerrito, Piedmont, and El Sobrante fell off by more than 10%. While this can create opportunities for budget-conscious buyers, sellers may be less motivated to put properties on the market in those cities.
The substantial drop in total sales volume in all six cities is in step with the bare fact that there are fewer homes on the market. With interest rates around 8% for a 30-year fixed-rate mortgage loan, this trend is likely to stay with us for the remainder of this year.
Looking forward, we’ll want to observe whether the demand for luxury homes in Richmond and Oakland persists, if median prices stabilize in El Cerrito, Piedmont, and El Sobrante, and how external factors like economic conditions and interest rates influence the market.
Stay tuned for future updates as we navigate the evolving landscape of East Bay real estate.
#RealEstateTrends, #EastBayHousingMarket, #MarketInsights, #FutureOfRealEstate, #RealEstate, #EastBayHousing, #MarketAnalysis, #HomeSales, #EastBayRealEstate
